
Maybe you will find this way easier.
It's a good way of mapping places that aren't strongly connected to Longitude/Latitude. Shops in shopping centres have their geographical coordinates but of course nobody uses them, so map consisting general shapes without details is fine in such situation.
I've mapped the very small shopping centre in Inkscape (vector graphics editor), you can use the same software as it's free or any other which you like. Inkscape starts counting X and Y from bottom left corner, or in other words in the same way as Tableau :)

You have to hover over each corner to get its coordinates.

Some graphics editors (for instance Gimp - raster graphics editor) start counting Y from upper corner, this is exactly the opposite to what Tableau and Inkscape do. In your spreadsheet you have to calculate new Y column (Max Y - Y) and you get the new corrected Y.

Place the coordinates to the spreadsheet file and number each node so Tableau will know how to draw the lines of polygons.


2. Add the Order to the Path
3. Add Shop to the Detail
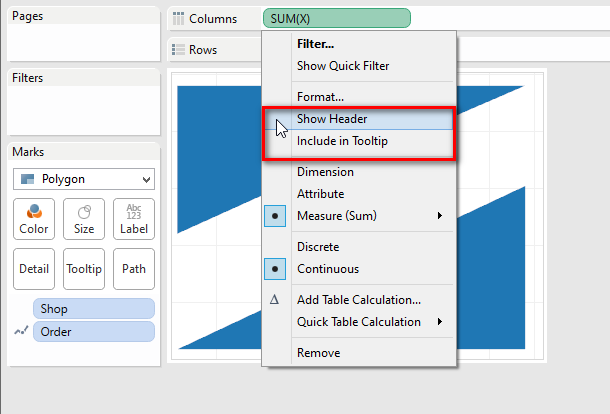
4. Place X to the Column and Y to the Row

Get rid of the details of X and Y from your Tooltip and Headers.
Enjoy mapping :)
No comments:
Post a Comment